

How Tether's demand planning module forecasts every SKU by channel
 Gary Sahota
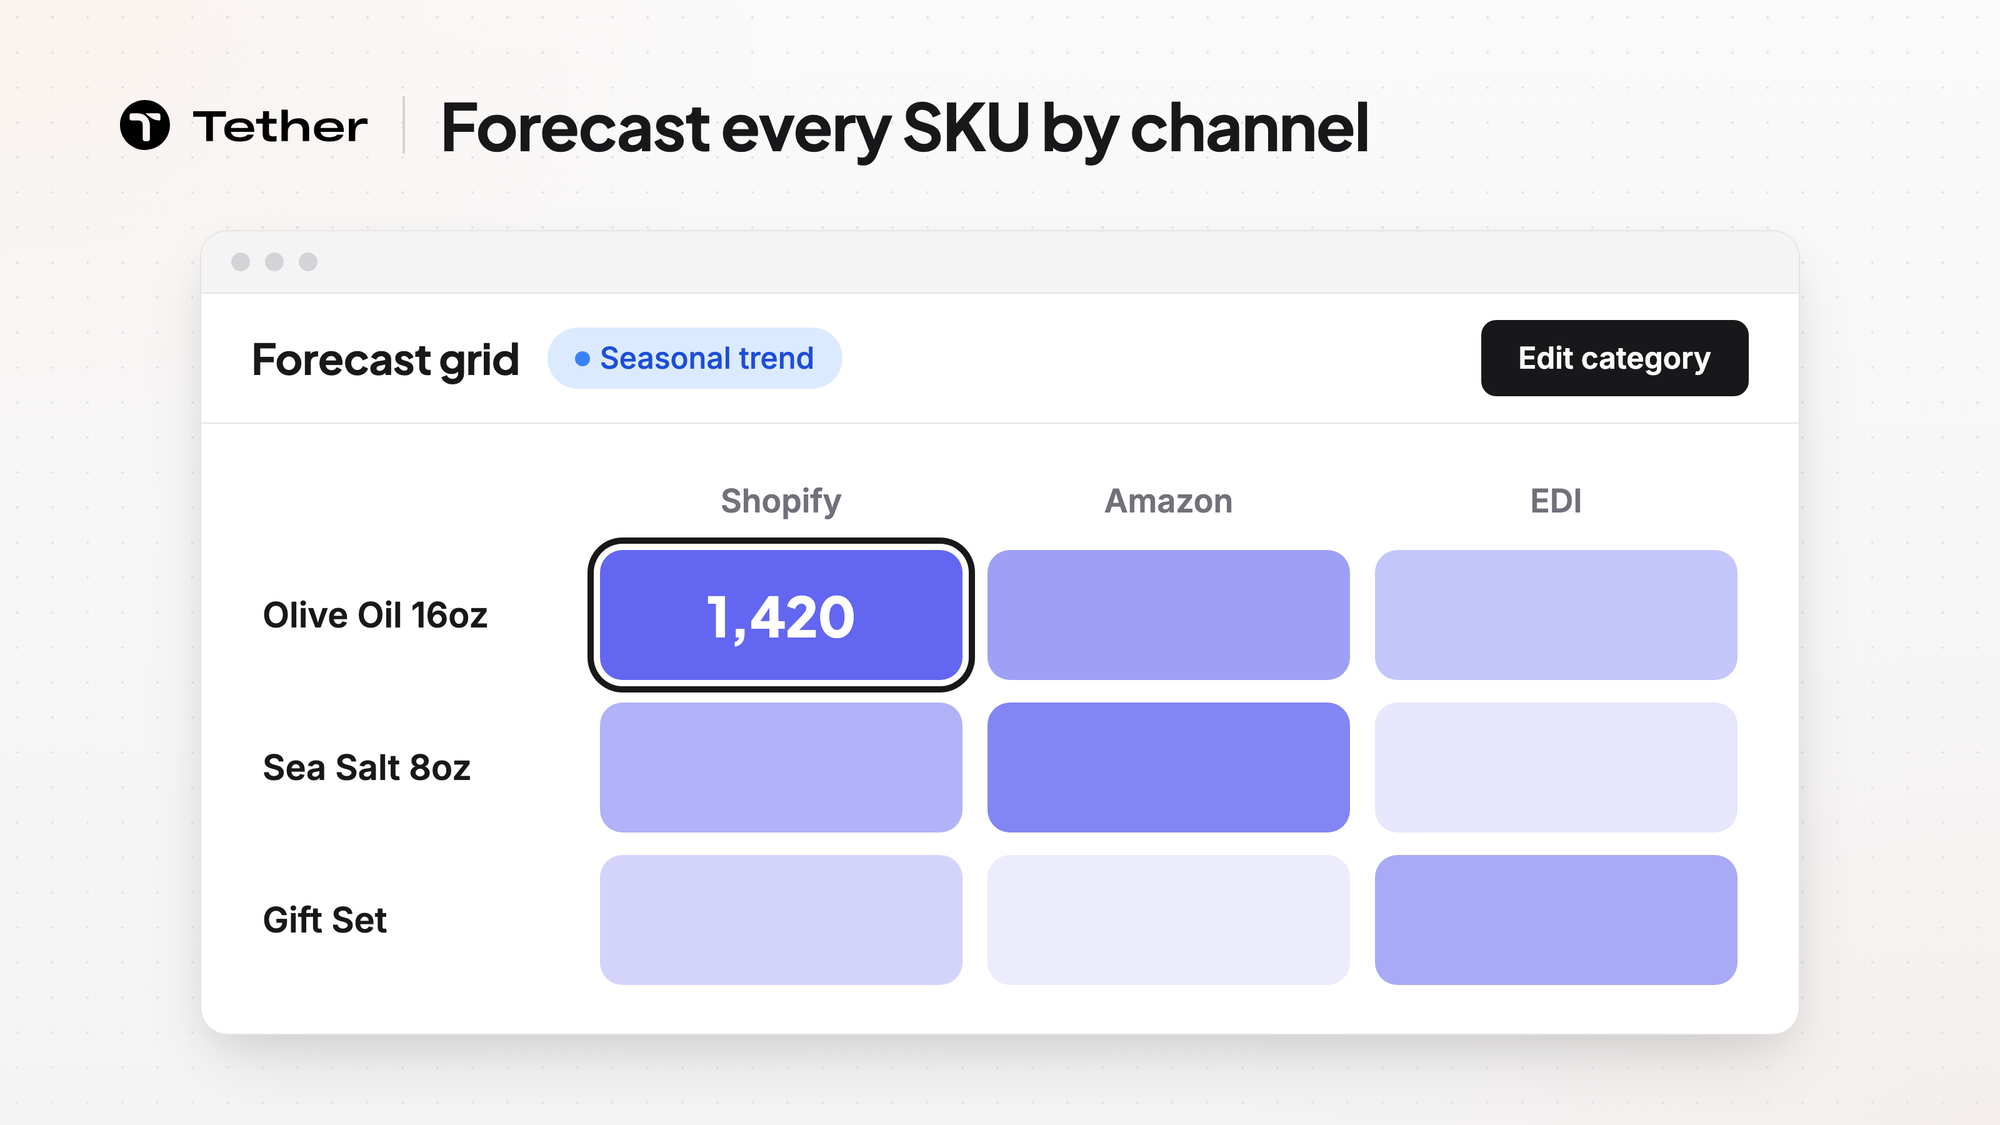
Tether forecasts demand for each SKU in each sales channel. Pre-built algorithms such as rolling averages, seasonal trends, and momentum run in the background, and different product lines can run different forecasting methods. When you edit a category, Tether spreads the change proportionally across its SKUs.
What demand planning is and why brands do it
Demand planning is the work of estimating how many units of each product your customers will buy, and when they will buy them. A plan usually looks several months ahead in weekly or monthly buckets, because suppliers and production runs need that much notice.
Brands plan demand because their biggest operating decisions start from that estimate. It sets how much to order from suppliers, when to book a production run, and how much stock to keep in each warehouse. A forecast that runs low means popular products sell out before the next order arrives. A forecast that runs high leaves you holding stock that does not sell.
Planners build the estimate from two directions. Bottom-up planning starts from each product and adds the pieces into a total. Top-down planning starts from a total for a category or a line and splits it across the products inside it. A number for one SKU and a number for a whole line rarely come from the same information.
Forecasts and sales history stay split by channel
Tether holds a separate demand forecast for each SKU in each channel it sells through. If an Olive Oil 16oz bottle sells on Amazon and on your Shopify store, it carries one forecast for Amazon and another one for Shopify. Wholesale accounts often order in large batches a few times a year while a store or marketplace sells a few units every day, so one blended number would hide both patterns. Our earlier look at food and beverage demand planning covers why channel-level planning matters.
Tether's demand planning takes in sales channel by channel through its integrations with Shopify, Amazon, and EDI, or from a centralized ERP.
You can slice your sales history by day, week, or month across every channel. A daily view shows the spike around a launch or a holiday, and a monthly view shows the longer trend.
Pre-built algorithms run in the background
Tether taps pre-built forecasting algorithms that run in the background, including rolling averages, seasonal trends, and momentum. In general forecasting terms, a rolling average smooths out week-to-week noise, a seasonal method leans on the shape of past years, and a momentum method reacts to a product that is speeding up or slowing down.
No single method fits a whole catalog, so you can run different forecasting methods for different product lines. A pantry line with steady repeat orders might use a rolling average, while a gift line that peaks in December uses seasonal trends.
Custom hierarchies group the forecast the way you plan
Tether lets you set up custom channel and product hierarchy fields and group the demand forecast grid by any of them. A channel field could sort your channels into DTC, marketplace, and wholesale. A product field could hold brand, category, or pack size.
The grid also groups by product, by channel, or by SKU. Grouping by channel puts one channel's SKUs together, such as everything you forecast for Amazon. Filters narrow the grid to the channels or SKUs you want to review.
Category edits spread across SKUs in proportion
You can edit the forecast at the category level and let Tether distribute the change proportionally across the SKUs in it. That is the top-down direction. It fits the moments when what you know is about a whole category and not about one product, such as a retailer giving the category more shelf space.
Say you expect the snacks category to sell more next quarter. You raise the category forecast, and each SKU in it moves with its share. A SKU that made up about a third of the category before the edit still makes up about a third after it.
FAQ
Does a category edit add the same number of units to every SKU?
The change is shared out in proportion, not split evenly. A SKU with a larger share of the category takes a larger part of the change, and a slow seller takes a smaller part.
Can I review one channel's forecast on its own?
Filter the forecast grid to that channel, such as Amazon, and the other channels drop out of view. To see one product across all of its channels instead, group the grid by SKU. You can also look at one channel's sales history by day, week, or month.
How do I choose a forecasting method for a product line?
Start from how the line sells. Steady repeat orders suit a rolling average, a holiday peak suits seasonal trends, and a line that is picking up speed or fading suits momentum. Each product line in Tether can run its own method.


